In this installment of the ‘Agronometrics In Charts’ series, Sarah Ilyas studies the state of the Chilean grape season. Each week the series looks at a different horticultural commodity, focusing on a specific origin or topic visualizing the market factors that are driving change.
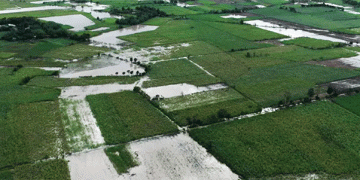
Water shortages, torrential rains during the harvest period and logistical duress took a heavy toll on Chilean grape volumes in the 2021-2022 season, problems with fumigation breaking the cold chain caused severe damages to fruit, resulting in inflated costs for producers and drops in consumer prices.
According to the first estimate for the season, it is expected that Chile will send 70.6 million standardized 8.2 kg boxes to the world in the 2022-2023 season. More than 22 million boxes are expected for traditional varieties, and roughly 12 million boxes of Red Globes are projected to be shipped.
Chilean producers export 260,000 metric tons of table grapes to the United States annually. Despite the 5.1% drop compared to the last season, the fruit is of good size and quality, which will ensure a sustained demand.

Source: USDA Market News via Agronometrics. (Agronometrics users can view this chart with live updates here)
Source: USDA Market News via Agronometrics. (Agronometrics users can view this chart with live updates here)
The arid climate of the Chilean summer is conducive to the production of quality fruit and enables the country to be the top grower of grapes in the southern hemisphere and the world. The Chilean Ministry of Agriculture is investigating a systems approach for Chilean grape exports, which would allow for the export of fumigation-free grapes to the US.
This is currently under review by the USDA’s Animal and Plant Health Inspection Service. The approach would help improve market access from Atacama, Coquimbo and Valparaiso. Currently, the fumigation process required reduces the quality and impacts the shelf life of the fruit, which results in lower prices from retailers and reduced competitiveness in the world market.
ASOEX Board of Directors recently endorsed the formation of a new Table Grape Committee; this measure was put in place in order to battle the challenges that are currently faced by the sector. The industry is taking quantum leaps towards boosting its competitiveness in international markets.

Source: USDA Market News via Agronometrics. (Agronometrics users can view this chart with live updates here)
In our ‘In Charts’ series, we work to tell some of the stories that are moving the industry. Feel free to take a look at the other articles by clicking here.
All pricing for domestic US produce represents the spot market at Shipping Point (i.e. packing house/climate controlled warehouse, etc.). For imported fruit, the pricing data represents the spot market at Port of Entry.
You can keep track of the markets daily through Agronometrics, a data visualization tool built to help the industry make sense of the huge amounts of data that professionals need to access to make informed decisions. If you found the information and the charts from this article useful, feel free to visit us at www.agronometrics.com where you can easily access these same graphs, or explore the other 21 commodities we currently track.
A source: https://www.freshfruitportal.com


